An Excel worksheet is limited to 1,048,576 rows and beyond this you cannot add new data. However, Power Pivot provides a high-performance environment where you can work with large datasets (beyond the 1M rows limit) and create simple or complex calculations. It allows you to create data models and establish relationships between different data sets.
Power Pivot is an Excel COM add-in. By default, it is disabled. To enable it;
- Go to File > Options > Add-Ins.
- In the Manage box, click COM Add-ins> Go.
- Check the Microsoft Office Power Pivot box, and then click OK. If you have other versions of the Power Pivot add-in installed, those versions are also listed in the COM Add-ins list. Be sure to select the Power Pivot add-in for Excel.
Once enabled, a Power Pivot tab will be added to the ribbon.

Watch the video below to see how you can load data into Power Pivot using Power Query.
Building Relationships in Power Pivot
Power Pivot allows you to create relationships between tables with at least one common variable/column. This allows you to create a complete report that filters through all your data. There are 2 types of relationships that you can create in Power Pivot.
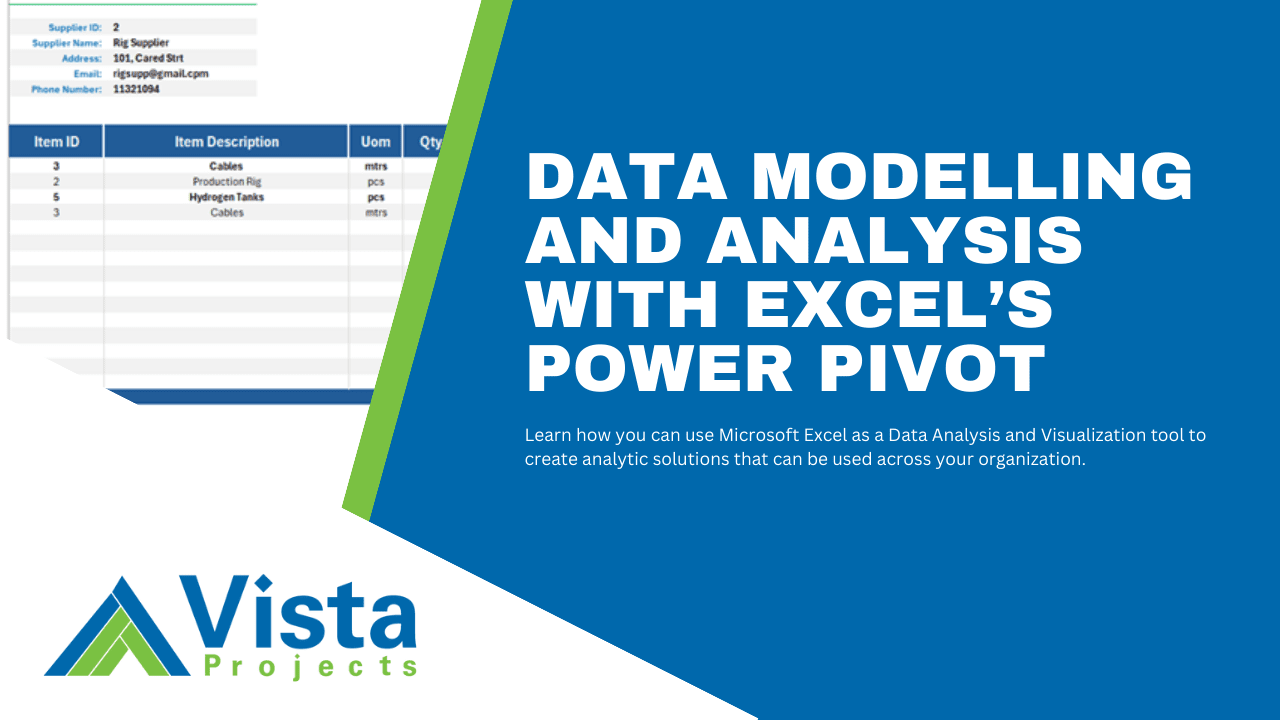
- One-to-One (1:1) Relationship – In this kind of relationship, each row in one table is linked to only one row in another table. This is mostly used when you want to store additional details about a specific record/entity. For example, you can have a single table of supplier names and another table with those supplier names, their contacts, and addresses.
- One-to-Many (1:*) Relationship – In this kind of relationship, each row in one table can be linked to many rows in another table. This is the most common type of relationship. For example, on the one side, you can have a table of your SKU items, and the on the many side, you can have a table of related purchase records.
There is another type of relationship, Many-to-Many (*:*), where many rows related to many rows in another table. However, Excel does not directly support this relationship but you can create it using a junction/associative table so that the two “many” tables are linked to the same “one” table. For example, assume you have a budget table for your item categories for each month, and another table containing purchase orders for items in these categories for each month. If you would like to know whether your purchase orders are within the budget, you would create a relationship between the item category column in the budget table and the PO table. However, because there are multiple entries of a single item category in each table, this would be a many-to-many (*:*) type of relationship and is not supported. To relate the two tables, you would have to create a dimension table that contains only unique item categories to act as the junction table. Then both your Budget table and PO table would relate to the Item Categories table via a one-to-many (1:*) relationship. With the two tables linked in this way, your Item Categories slicer should originate from the Item Categories table so that you can filter both PO table and Budget table at the same time.

Creating a Calendar for your Data
One more thing to consider when creating a data model is having a dedicated “Dates Table”. If your data has a date range of 3 years, and you have a FACT table that contains all the dates within this range, you can use it as a date table. However, if none of your FACT tables contain all the dates within this range, you should create a dedicated dates table. This is necessary because if you have a table that contains dates not present in another related table, or it contains multiple entries for a single date, you cannot create a single date filter/slicer. To be able to view all your date within the context of the same date period(s) you would need a dimension dates table containing all the dates (unique dates) in your data. You would then create a one-to-one(1:1) or one-to-many(1:*) kind relationship between this table and all the tables in your data containing a date column.
To learn more about creating relationships and creating a data model, watch the video tutorial below.
Looking for project-driven supply chain management software?
Current SCM is the first of its kind – supply chain management software purpose-built to support the most complex procurement and materials management projects. With materials management and vendor document requirements uniquely integrated into the order, Current SCM provides a unified, collaborative platform to streamline the end-to-end process of project-driven procurement and materials management.
If you are engaged in any direct procurement, technical procurement, project procurement or third-party procurement, Current SCM will improve your procurement and materials management workflow. If you are engaged in all four, Current SCM will revolutionize the way you do business.
Contact our sales professionals at Current SCM today!